Introduction
The density profile is a key characteristic when determining the physical and mechanical properties of a panel. The density profile, measured perpendicular to the panel surface, gives you the different density ranges over the entire panel. Depending on its shape, the density profile has a decisive influence on surface roughness and surface quality after sand.

Figure 1: Density profile perpendicular to the panel surface

Figure 2: The density curve perpendicular to the surface of a particle panel
Figure 1 shows a typical density profile perpendicular to the panel surface. The peaks to the left and right of the curve show the density in the top and bottom top layers (see also Figure 2). A panel manufacturer looks for a high density in the top layer and a low density in the core layer. This is the only way to produce a panel with good mechanical properties and low weight.
A short digression

Figure 3: Various types of (pressed) particle panels
Figure 3 shows different types of pressed particle panels. They differ in the number of layers. The more layers there are, the greater the difference in density between the top layer and the core layer.
The smaller the chips in the top layer, the larger the specific surface area of the chips. That means higher resin consumption with the following consequences:
- Higher production costs for the top layer
- Higher weight
- Higher density
- More closed/smoother surface
The larger the chips, the higher the porosity because of the greater air flow rate around the particles.
You can only achieve a different density for the MDF panel with the press program of the hot press.

Figure 4: Double belt press (Siempelkamp 2008)
The press program specifies the temperature of the heating plates, the pressure of the press and the speed of the steel belts. The faster the steel belts run, the lower the pressure/time factor and the faster production. As shown in Figure 4, the chip mat is fed in on left. The surface of the mat is heated by the heating plates (conductive heat transfer). Water in the top layer evaporates so that the gas pressure increases. Hot steam begins to flow from the cavities of the mat towards the gas pressure drop in the center of the panel. When the steam encounters colder chips, it condenses back to unbound water, creating condensation energy.
The temperature in the middle of a panel rises to up to 100 °C as a result.
When the surface is dry, heat gets to the core layer via conduction. While the temperature in the middle of the panel increases, unbound water evaporates again and the gas pressure increases (Figure 5). If the gas pressure is higher than the internal adhesion after pressing, the panel expands (swells). This can, however, be prevented by reducing the production speed.

Figure 5: Distribution of gas pressure from a 16 mm particle panel (Thoemen, Walther 2010)
Series of experiments & results
Our experiments examined the influence of density on the roughness of a sanded MDF panel more closely. To investigate, 7.20 mm-thick MDF panels were sanded to
- 6,95 mm
- 6,80 mm
- 6,50 mm
- 6,25 mm and
- 5,60 mm
Sanding was done with grit size P150.
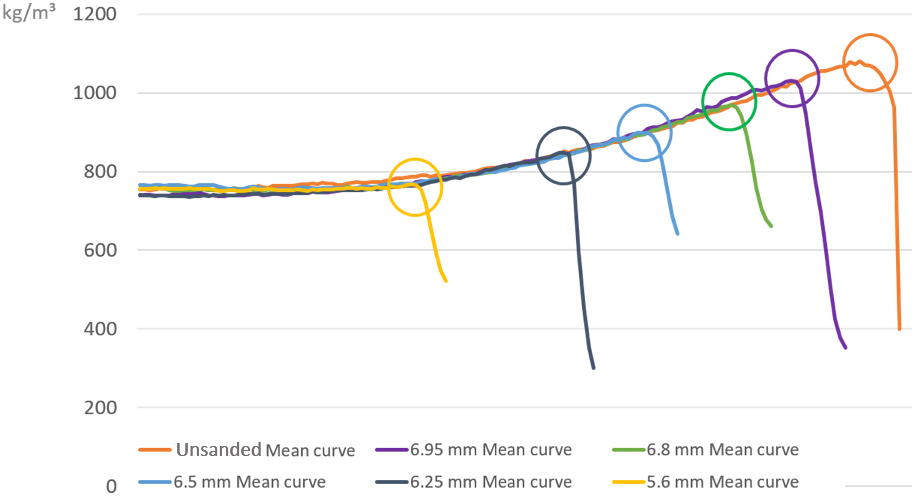
The density profile of all panels was measured. The results are shown in Figure 7.

Figure 6: Right side of the density profile of sanded panels
Only the right side of the density profile is shown, as the panels were only sanded on one side. The circle marks the point of the highest surface density. As its clear, the density decreases with greater sanding.
Figure 7 shows the relationship between surface density and roughness. The higher the density, the lower (i.e. better) the roughness.

Figure 7: Density profile of the sanded plates (one side only)
This can be explained by the porosity of the material. The lower the density, the higher the porosity.
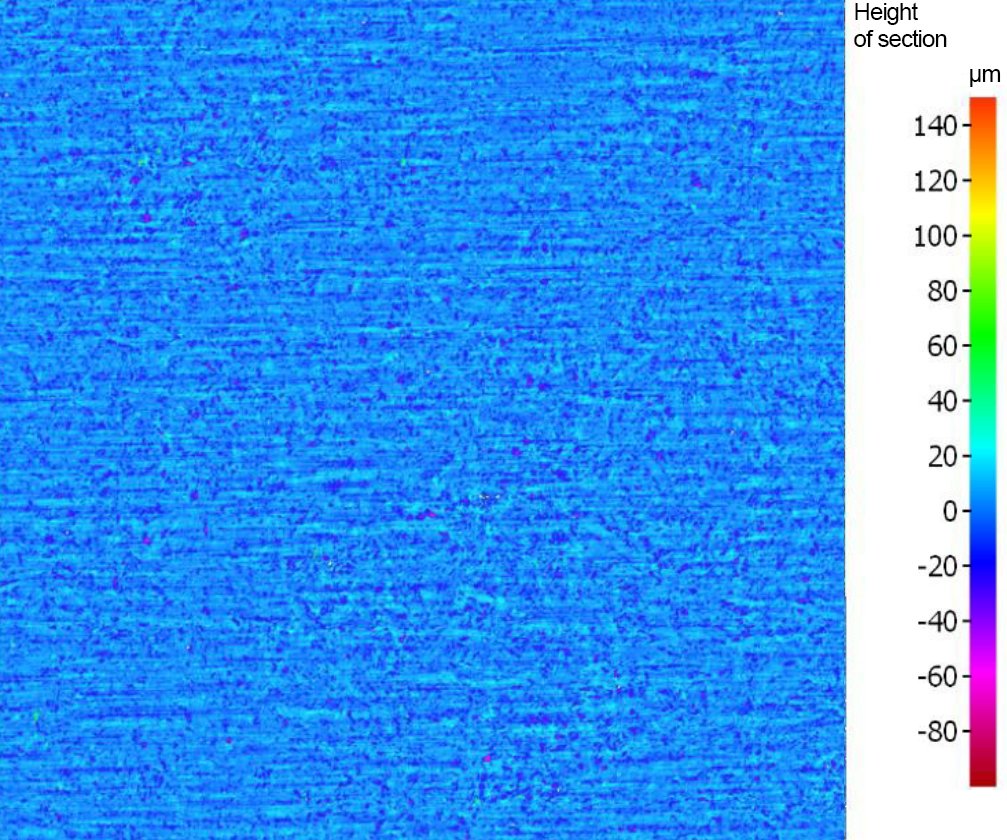
Figures 8 to 13 show the surface of each sanded plate. The first figure shows the scratches of the belt grit on the surface. As sanding depth increases, however, the surface structure is increasingly determined by the porosity of the panel itself and not by the sanding belt.

Figure 8: Surface of the 6.95 mm panel

Figure 9: Surface of the 6.80 mm panel

Figure 10: Surface of the 6.55 mm panel

Figure 11: Surface of the 6.25 mm panel

Figure 12: Surface of the 5.93 mm panel

Figure 13: Surface of the 5.60 mm panel
Summary
The lower the density in the surface, the lower the surface quality. Despite using the same grit size, the roughness of the surface increases with decreasing surface density. This is important for the customer. If the customer sands too deeply, the customer gets more and more into the range of the panel with lower density and the surface becomes rougher. This can also happen if the customer sands more on one side than on the other. In this case, the sanding machine has to be readjusted.
Normally, all particle panels have a higher density at the bottom surface than at the top surface. This is a result of manufacturing process. Small vibrations of the conveyor system in the forming station cause the finer chips to migrate to the bottom layer of the mat. This leads to a higher density in the bottom surface. The panel plate chooses the easiest route as it passes through the machine because of the self-aligning conveyor table system of the sanding machines. This means that the high-density panel parts are sanded less than those with a lower density. In extreme cases, the difference in density between the top and bottom surfaces can be even higher after sanding, which leads to large differences in the roughness of the top and bottom surfaces.
If the customer has problems with different surface densities, the satos TSQ conveyor table system can help. The system has bottom conveyors tables that are fixed to the machine.
This allows the operator to align the conveyor system to sand more on the underside than on the top.